
1. 安装ggplot2及其依赖
按照官方文档,输入以下指令进行安装:
|
|
根据经验,其实只需要安装tidyverse就可以了:
|
|
安装完成之后,加载ggplot2包:
|
|
2. ggplot2重要概念
2.1 Layer
A layer is a collection of geometric elements and statistical transformations. – ggplot2: Elegant Graphics for Data Analysis
Layer 是几何元素以及统计转换的集合。 几何元素代表你能在图表上看到的元素:点、线、多边形等。 统计转换对数据进行了总结,例如整理和计算观察结果以创建直方图,或拟合线性模型。
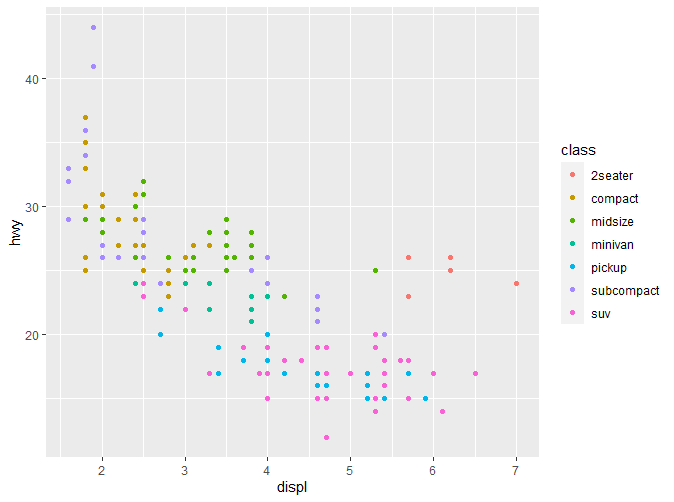
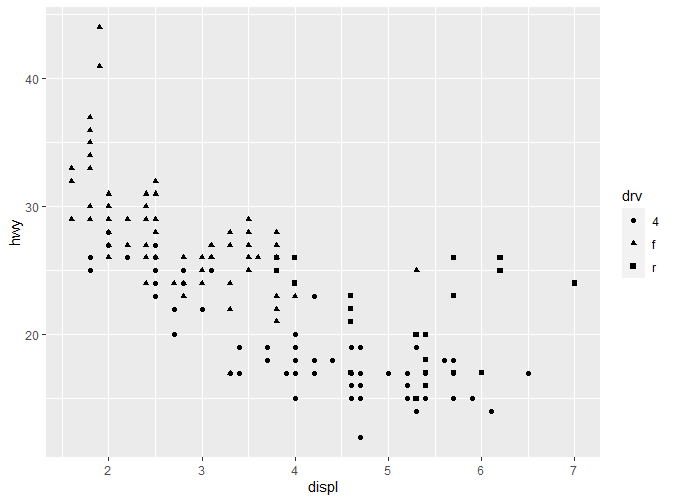
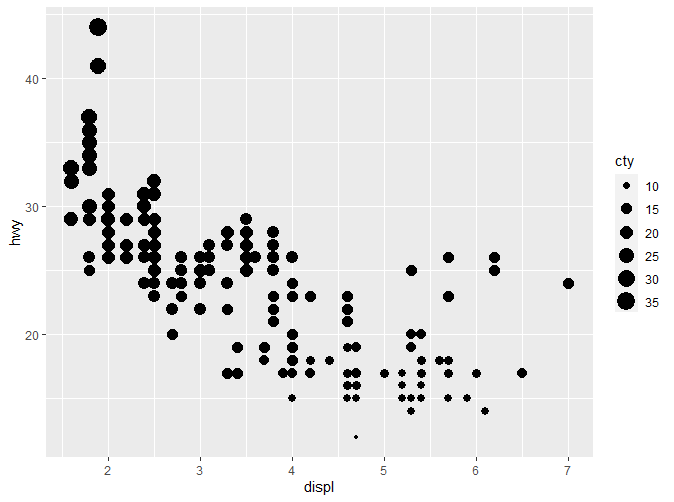
2.2 Scale
Scales map values in the data space to values in the aesthetic space. – ggplot2: Elegant Graphics for Data Analysis
Scales 将数据从数据空间映射到了美学空间。这种映射包括使用颜色、形状、大小等。同时Scale还包括绘制图例和轴线。
2.3 Coordinate system
A coord, or coordinate system, describes how data coordinates are mapped to the plane of the graphic. – ggplot2: Elegant Graphics for Data Analysis
我们常用的坐标系是笛卡尔坐标系。其他的坐标系包括极坐标系等。
2.4 Facet
A facet specifies how to break up and display subsets of data as small multiples. – ggplot2: Elegant Graphics for Data Analysis
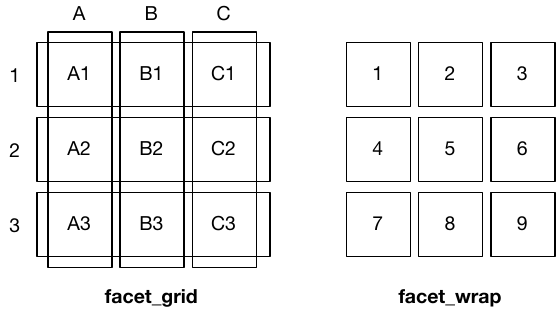
常见的facet有三种:null,wrap,grid。
- null: 常见的单张图表。
- wrap: “wraps” a 1d ribbon of panels into 2d. (实际是一维)
- grid: produces a 2d grid of panels defined by variables which form the rows and columns. (二维)
wrap和grid具体的区别会在之后章节涉及,下图直观描述了它们的区别:
2.5 Theme
A theme controls the finer points of display, like the font size and background colour.
– ggplot2: Elegant Graphics for Data Analysis
欢迎关注我的公众号和小红书呀~
| 微信公众号 | 小红书 |
|---|---|
 |
 |